Data analytics is becoming not just more prevalent, but more useful for business.
As someone with a mathematical, financial and technological background, I am a strong proponent of the benefit of analyzing and using data to make better decisions. Not surprisingly, then, I am happy to see a number of trends and emerging technologies that promise to help in that effort.
The first is that data sources are becoming more open and easier to connect to. This trend exists in virtually all modern applications. One example of interest to those of us who live or work in New Orleans is the DATADRIVEN NOLA website, on which the city of New Orleans publishes over 100 different data sets, such as building permits, 311 calls and police reports.
These data are readily available for viewing on the site in table form, and can also be downloaded as a file and opened in Microsoft Excel for immediate analysis. But they also support a variety of different live connections to allow either Excel or a purpose-built data analytics application to connect in a more permanent way and always use the most recent available data.
Which brings us to the second trend — the emergence of data analysis and manipulation applications. Microsoft Excel, when fully utilized, is a superb data analytics tool, but as my colleague John Marshall wrote about in the October 2016 issue of Biz New Orleans, other applications like Microsoft PowerBi and Tableau are even more powerful in their ability to create and share data visualizations.
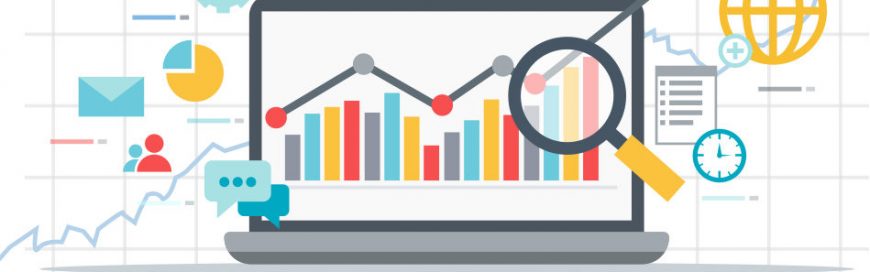
Visualizations are all about helping us interpret, understand, or connect data to make them more useful. If you have a table of building permits or police reports and show them on a map it’s much easier to truly get a sense of what’s going on in your neighborhood. Chart them over time, and it’s easier to spot trends. (The data.nola.gov website also has a full complement of charts and maps.)
New tools also make it easier to connect or integrate disparate data sets. Simple cloud-based tools like Zapier and Microsoft Flow and enterprise applications like SnapLogic and Microsoft SQL Server Integration Services make it easier than ever to automate the process of taking data from one place, cleaning it up and sending or connecting it to something somewhere else.
Now, even when using the latest tools with good data, I acknowledge that many data analytics projects consist of simply making the same data or charts we have always had more accessible. Instead of a monthly report, it’s a real-time dashboard. Or instead of taking four hours to download and manipulate a proprietary file, it’s instantly available in Excel.
These projects can be extremely beneficial — I don’t want to minimize their importance — but ultimately, we can and will do much more.
A final trend is the ability for technology to help us make sense of our data. This is the promise of machine learning and broader artificial intelligence, to which the Googles and Microsofts of the world are devoting significant attention and resources.
From a business executive’s perspective, machine learning means that computers can analyze data, find patterns and give us useful insights without our having to program them to connect the dots. As a simple example, we might feed in disconnected marketing and sales data, and the computer might tell us which combination of marketing activities most effectively leads to more sales.
This ability exists today, and is probably used more often that many of us realize. Still, while you don’t have to tell the computer how to draw conclusions, you do have to prepare the data carefully and define a model. We’re still a ways away from computers doing all the work for us.